|
Geoguardian presents environmental contents based on satellite images and maps. This website deals with environmental and related research interests and is frequently updated with the latest environmental content. Kithsiri Perera - USQ, QLD, Australia, 2005-2015 |
Environmental Contents Archive 2008 (selected)
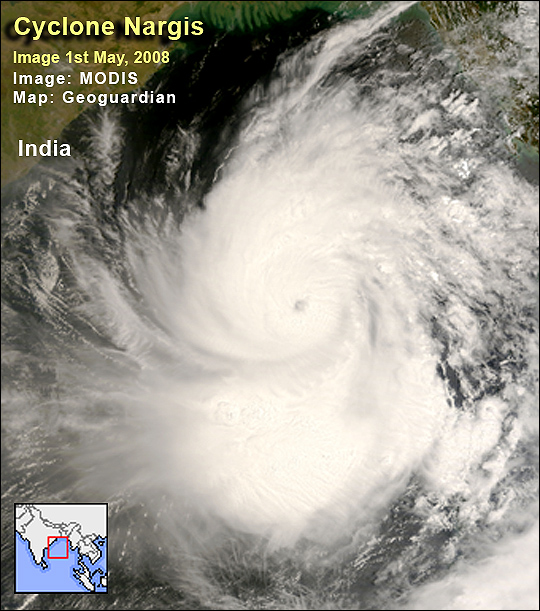
Cyclone Nargis
The deadly cyclone Nargis roamed for a few days over the Bay of Bengal and finally slammed into the Irrawaddy delta of Myanmar, causing devastating damage. According to the latest information, already over 240 deaths have been reported from Rangoon city and the surrounding delta region when Cyclone Nargis hit with wind speeds of 190km per hour. The government has declared the affected areas as disaster areas, while Rangoon International Airport was closed for all flights. At an early stage, clouds belonging to Nargis brought heavy rains to Sri Lanka, killing about 6 people due to floods. The NASA’s MODIS satellite image in the figure shows a huge cloud formation of Nargis over the Bay of Bengal in 1st of May. Cyclone Narigs became one of the most devastating storms to hit Myanmar in recent years.
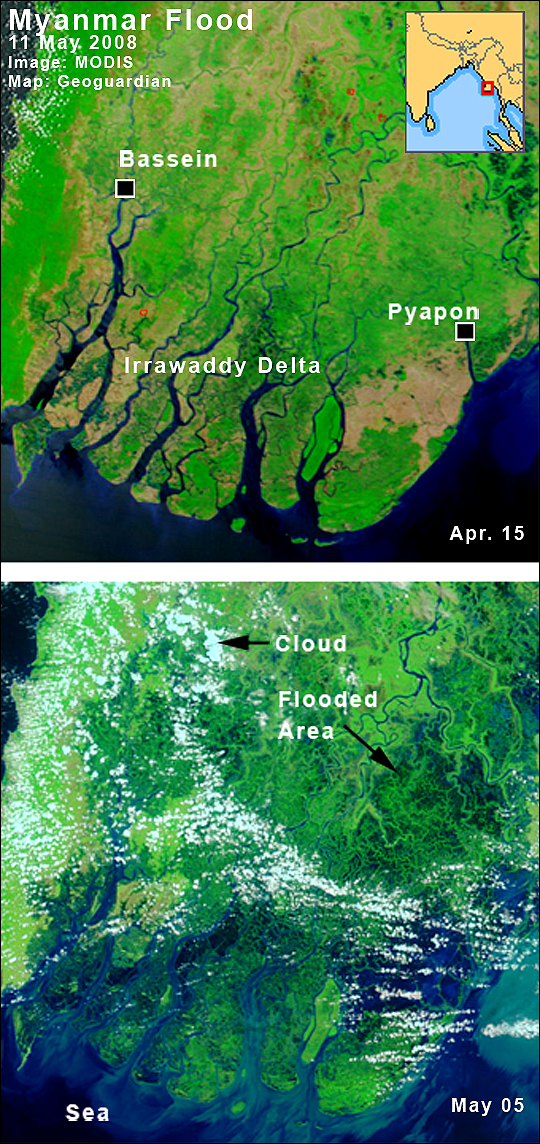
Myanmar Disaster
The disaster caused by the deadly cyclone Nargis became one of the worst cyclone disasters in decades. The Myanmar government says the death toll as 23,33 with another 37,000 missing. But aid agencies predict the death toll may climb past 100,000. A huge region of the delta has submerged for days, increasing the damage and delaying relief efforts. Now, after one week from the disaster, finally aid is reaching the affected areas through numerous administrative problems. These two images are showing flooded river delta area before and after the flood. Black and dark blue areas among green and yellow land are flooded areas.
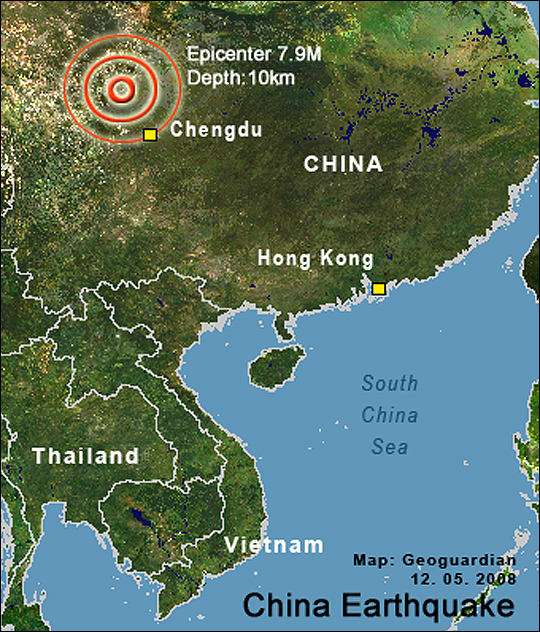
Deadly Earthquake
According to Chinese government information, a powerful earthquake with 7.9 M hit Beichuan County of mountainous Sichuan province, China, killing thousands of people. The quake hit just below 10km from the surface and buried thousands of people under collapsed buildings. The casualty figure rose sharply, and by 14th May, it had reached 15,000. According to local news, only 2,300 of the 10,000 residents in the southwestern town of Yingxiu survived the earthquake. The government started to airdrop aid, as roads were not accessible due to landslides and the impact of the quake. The map shows the quake epicentre, and the report says the devastating shock has felt as far as Vietnam. Sichuan Province, in the central southwest, is one of the most fertile and agriculturally important areas in China and the third most populous province.
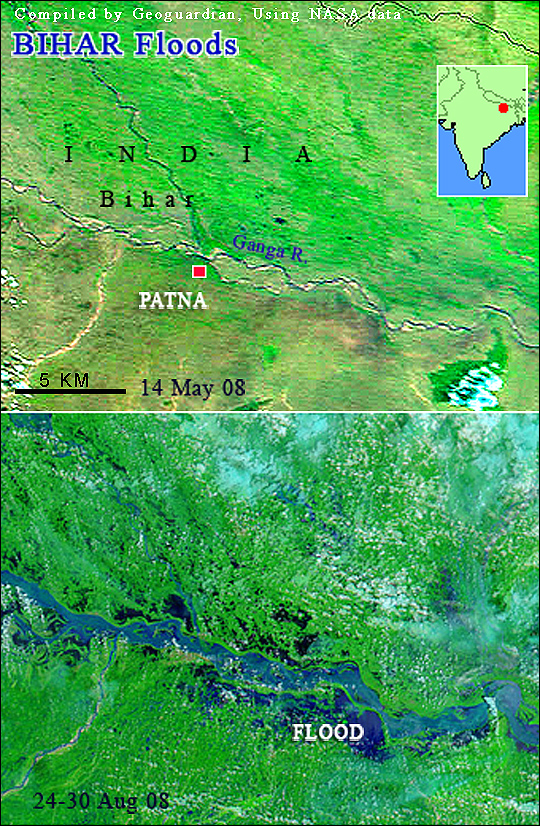
Devastating Indian flood
Over 2 million people became homeless in the northeast Bihar district in India, after a record-breaking flood devastated the region since last week. Indian police said over 70 people died due to flood-related incidents so far. Images show clearly the flooded Ganga river valley, in this MODIS satellite image comparison of the composite image of 24 and 30 August image and the 14th May clear sky image. A 3 to 5 km wide land strip along the river, with hundreds of villages, has been inundated. Still, monsoon thunderstorms are continuing over the area, and millions of people have affected in a huge area from north central India to the northeast.
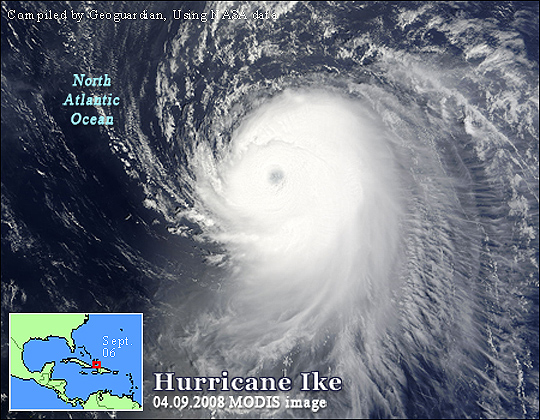
Hurricane Ike
The Caribbean region faced a number of devastating hurricanes in the last few weeks. Aggregating the misery, another extremely dangerous storm, Hurricane Ike, is now hammering the region. The image shows the early stage of the hurricane, recorded by the MODIS satellite on 4th Sept. Its current location is shown on the inserted map. According to weather records, Ike is having a 216 km per hour wind speed now (by 7th Sept). The weather forecast indicates Ike’s path, crossing Cuba in the next 48h before entering the Gulf of Mexico. If the hurricane maintains its devastating power, it will force another evacuation of millions of people in the US southern coastal area.
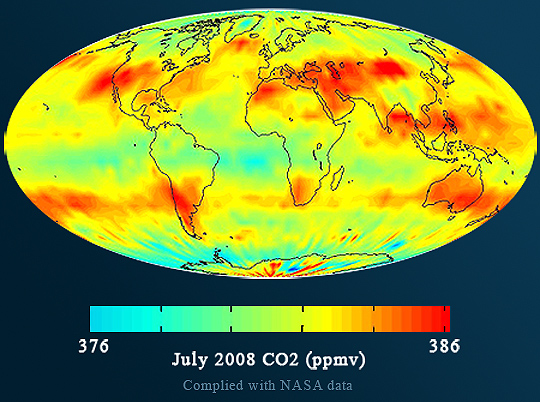
The first global carbon dioxide image
For the first time, a NASA/university research team has produced an image covering the entire globe to show the greenhouse gas carbon dioxide in Earth's mid-troposphere, the region about 8 km above the Earth's surface. This product will help ongoing research works on global warming and climate change studies. The map shows how carbon dioxide is distributed in the atmosphere and how moved around, during July 2008. Red colour shows heavy CO2 concentrations with 386.2 parts per 1 million as the highest value. The image was produced with data acquired from AQUA satellite’s AIRS (Atmospheric Infrared Sounder) sensor.
|
Geoguardian © 2005-2015. All rights reserved.